Environment

Preparing for the environment section in UPSC involves a comprehensive understanding of environmental issues, policies, and their impact on society and ecosystems. Here’s a structured approach to help you prepare effectively:
Measurement of Biodiversity
Environment

Measurement of Biodiversity Explained

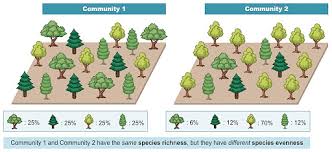
Measurement of Biodiversity Measuring biodiversity is essential for understanding the health of ecosystems, assessing the impacts of human activities, and implementing effective conservation strategies. Biodiversity can be measured at different levels, including genetic, species, and ecosystem diversity. Various indices and methods are used to quantify these aspects of biodiversity. 1. Genetic Diversity Definition: Genetic diversity refers to the variation of genes within species. It is measured by examining the number and frequency of alleles (gene variants) in populations. Measurement Methods: Allelic Richness: The number of different alleles present in a population. Heterozygosity: The proportion of individuals in a population that are heterozygous (carrying two different alleles for a gene). Genetic Distance: Measures the genetic divergence between populations or species, often using molecular markers like DNA sequences. Example: Microsatellite Analysis: Utilized to assess genetic variation within a population by examining specific, highly variable DNA regions. 2. Species Diversity Definition: Species diversity refers to the variety and abundance of different species within a particular region or ecosystem. It includes species richness and species evenness. Measurement Indices: Species Richness (S): The total number of different species in a given area. Simpson’s Diversity Index (D): Measures the probability that two individuals randomly selected from a sample will belong to the same species. Shannon-Wiener Index (H’): Accounts for both species richness and evenness. Higher values indicate greater diversity. Margalef’s Index (d): Relates species richness to the number of individuals in a sample. Example: Quadrat Sampling: A method where a square plot (quadrat) is used to count the number of species and individuals within that plot to estimate species diversity in larger areas. 3. Ecosystem Diversity Definition: Ecosystem diversity refers to the variety of ecosystems within a geographic location. It encompasses the different habitats, communities, and ecological processes in the environment. Measurement Approaches: Habitat Diversity: The number of different habitat types within a region. Landscape Diversity: The variety of ecosystems or land uses in a landscape, often measured using satellite imagery and GIS (Geographic Information Systems). Ecosystem Function Diversity: Measures the variety of processes such as energy flow, nutrient cycling, and food web dynamics within ecosystems. Example: Remote Sensing: Using satellite imagery to map and analyze different ecosystems and their spatial distribution. Methods of Biodiversity Measurement Field Surveys: Transect Lines: A line is drawn through a habitat, and observations are made at regular intervals to record species presence and abundance. Quadrat Sampling: Small, square plots are sampled to estimate species richness and density. Molecular Techniques: DNA Barcoding: Identifies species using a short, standardized region of genetic material. Genetic Markers: Analyzes genetic variation using specific DNA sequences to assess genetic diversity. Statistical Models: Rarefaction Curves: Plots the number of species against the number of individuals sampled, helping to estimate species richness in a community. Diversity Indices: Calculate species diversity based on richness and evenness, such as the Shannon-Wiener and Simpson’s indices. Challenges in Measuring Biodiversity Scale and Sampling: Biodiversity measurements can vary significantly depending on the spatial and temporal scale of sampling. Taxonomic Challenges: Accurate species identification can be difficult, particularly in regions with high biodiversity or limited taxonomic expertise. Data Availability: In some areas, comprehensive data on species distributions and abundances are lacking. Conclusion Measuring biodiversity is complex and multifaceted, involving various levels and methods to capture the full extent of biological variation. Accurate and comprehensive measurements are essential for effective biodiversity conservation and management. Practice Questions on Levels of Biodiversity Genetic Diversity What is genetic diversity and why is it important for the survival of a species? Explain the methods used to measure genetic diversity within a population. Describe an example where genetic diversity has played a crucial role in species survival. Species Diversity Define species diversity and explain its two main components. How do the Simpson’s Diversity Index and the Shannon-Wiener Index differ in measuring species diversity? Give an example of an ecosystem with high species diversity and explain the factors contributing to this diversity. Ecosystem Diversity What is ecosystem diversity and why is it vital for ecological stability? Describe the methods used to measure ecosystem diversity in a region. Provide an example of how ecosystem diversity can be assessed using remote sensing technology. General Biodiversity Discuss the interconnection between genetic, species, and ecosystem diversity. What challenges are faced in measuring biodiversity accurately? Explain the role of biodiversity conservation in sustainable development. Applied Questions You are a conservation biologist tasked with assessing the biodiversity of a tropical rainforest. Outline the steps you would take to measure genetic, species, and ecosystem diversity. A certain species of plant is facing a decline in population due to habitat loss. How would you assess the genetic diversity of this species to inform conservation efforts? Explain how the concept of ecosystem diversity can be integrated into urban planning to enhance city resilience. Case Studies Case Study: Genetic Diversity in Agricultural Crops. Discuss the importance of maintaining genetic diversity in agricultural crops and the methods used to preserve it. Case Study: Coral Reefs. Analyze the species diversity in coral reefs and the threats they face. What measures can be taken to protect this diversity? Case Study: Landscape Diversity in the Amazon Rainforest. Describe the types of ecosystems found in the Amazon and how landscape diversity contributes to its overall biodiversity. Critical Thinking Critically evaluate the effectiveness of protected areas in conserving biodiversity at all three levels. Debate the pros and cons of using molecular techniques versus traditional field surveys in biodiversity measurement. Propose a research study aimed at understanding the impact of climate change on genetic diversity in Arctic wildlife populations. Also Read Biogeographic Zones In India Explained Levels of Biodiversity Detailed Analysis Ecological succession Detailed Analysis Bio-geochemical cycles Detailed Analysis Ecological Pyramid Detailed Analysis

Biogeographic Zones
Environment

Biogeographic Zones In India Explained

Biogeographic Zones In India Explained Biogeographic zones are regions of the world with distinct climates, vegetation, and animal life. India, with its vast and diverse landscape, is divided into several biogeographic zones. Each zone has unique ecological characteristics and biodiversity. Here are the major biogeographic zones in India: 1. Trans-Himalayan Zone Location: Northern part of India, including regions of Ladakh and parts of Jammu and Kashmir. Climate: Cold desert climate with sparse vegetation. Flora and Fauna: Characterized by cold desert vegetation. Key species include the snow leopard, Tibetan antelope, and several unique species of birds. 2. Himalayan Zone Location: Extends from Jammu and Kashmir to Arunachal Pradesh. Climate: Varies from subtropical in the foothills to alpine and tundra in higher elevations. Flora and Fauna: Rich in biodiversity, including species like the Himalayan monal, red panda, and a variety of rhododendrons. 3. Indian Desert Zone Location: Includes the Thar Desert in Rajasthan and parts of Gujarat. Climate: Arid with extreme temperature variations and low rainfall. Flora and Fauna: Adapted to arid conditions. Key species include the Indian gazelle, desert fox, and several species of lizards and snakes. 4. Semi-Arid Zone Location: Central India, including parts of Rajasthan, Gujarat, and the Deccan Plateau. Climate: Semi-arid with moderate rainfall. Flora and Fauna: Dominated by dry deciduous forests and grasslands. Key species include blackbuck, Indian wolf, and various species of birds and reptiles. 5. Western Ghats Zone Location: Extends along the western coast of India, from Maharashtra to Kerala. Climate: Tropical with heavy monsoon rains. Flora and Fauna: Known for its rich biodiversity and high level of endemism. Key species include the lion-tailed macaque, Malabar giant squirrel, and numerous species of amphibians and plants. 6. Deccan Plateau Zone Location: Covers most of central and southern India. Climate: Tropical climate with distinct wet and dry seasons. Flora and Fauna: Dominated by dry deciduous forests. Key species include the Indian giant squirrel, sloth bear, and a variety of bird species. 7. Gangetic Plain Zone Location: North-central India, including Uttar Pradesh, Bihar, and West Bengal. Climate: Subtropical with hot summers and cool winters. Flora and Fauna: Fertile alluvial soil supports dense human populations and agriculture. Key species include the Indian rhinoceros, Bengal tiger, and various freshwater fish. 8. North-East India Zone Location: Includes the states of Assam, Meghalaya, Nagaland, Manipur, Mizoram, Tripura, and Arunachal Pradesh. Climate: Humid subtropical with heavy rainfall. Flora and Fauna: Rich in biodiversity and endemism. Key species include the hoolock gibbon, clouded leopard, and numerous species of orchids and bamboo. 9. Islands Zone Location: Includes the Andaman and Nicobar Islands and the Lakshadweep Islands. Climate: Tropical climate with high humidity and rainfall. Flora and Fauna: Unique island ecosystems with many endemic species. Key species include the Andaman wild pig, Nicobar pigeon, and various coral and marine life forms. 10. Coastal Zone Location: Long coastline stretching from Gujarat to West Bengal. Climate: Tropical maritime climate. Flora and Fauna: Mangroves, estuaries, and lagoons. Key species include saltwater crocodiles, olive ridley turtles, and various species of marine fish and invertebrates. These zones are crucial for conservation efforts as they help in understanding the distribution of species and ecosystems, planning for protected areas, and addressing environmental challenges unique to each region. Questions For Practice Multiple Choice Questions (MCQs) Which biogeographic zone in India is characterized by cold desert vegetation and species such as the snow leopard and Tibetan antelope? a) Himalayan Zone b) Trans-Himalayan Zone c) Indian Desert Zone d) Semi-Arid Zone The Western Ghats are known for their high level of endemism. Which of the following species is endemic to this region? a) Indian rhinoceros b) Malabar giant squirrel c) Indian gazelle d) Clouded leopard Which biogeographic zone covers most of central and southern India and is dominated by dry deciduous forests? a) Gangetic Plain Zone b) North-East India Zone c) Deccan Plateau Zone d) Coastal Zone The Andaman and Nicobar Islands are part of which biogeographic zone? a) Islands Zone b) Coastal Zone c) North-East India Zone d) Himalayan Zone Which zone is characterized by a humid subtropical climate with heavy rainfall and includes states like Assam and Meghalaya? a) Indian Desert Zone b) Semi-Arid Zone c) North-East India Zone d) Western Ghats Zone Short Answer Questions Describe the climatic conditions and typical flora and fauna of the Indian Desert Zone. What are the main ecological features of the Gangetic Plain Zone? Explain the significance of the Western Ghats in terms of biodiversity and conservation. Discuss the unique ecological characteristics of the Trans-Himalayan Zone. How does the Coastal Zone contribute to the biodiversity of India? Provide examples of species found in this zone. Essay Questions Analyze the role of biogeographic zones in shaping the biodiversity of India. How do these zones aid in conservation planning? Discuss the challenges faced by the Western Ghats in terms of environmental degradation and conservation efforts. What measures can be taken to protect this vital region? Evaluate the impact of climate change on the Himalayan and Trans-Himalayan zones. What strategies should be adopted to mitigate these impacts? Examine the importance of the North-East India Zone in the context of India’s overall ecological balance. Highlight the key conservation priorities for this region. Assess the role of the Coastal Zone in India’s economy and ecology. How can sustainable development be achieved in this zone without compromising its biodiversity?   Also Read Levels of Biodiversity Detailed Analysis Ecological succession Detailed Analysis Bio-geochemical cycles Detailed Analysis Ecological Pyramid Detailed Analysis Energy Flow Detailed Analysis

Environment

Levels of Biodiversity Detailed Analysis

  Levels of Biodiversity Detailed Analysis Biodiversity, or biological diversity, encompasses the variety of all life forms on Earth. It is commonly classified into three major levels: genetic diversity, species diversity, and ecosystem diversity. Understanding these levels is crucial for conservation efforts, ecological studies, and maintaining the balance of life on Earth. 1. Genetic Diversity Definition: Genetic diversity refers to the variety of genes within a species. It includes the differences in DNA sequences among individuals of the same species and among populations of the same species. Importance: Adaptability: Genetic diversity allows species to adapt to changing environments, resist diseases, and avoid inbreeding problems. Evolution: It is the raw material for evolution, enabling species to evolve over time in response to environmental changes. Survival: Higher genetic diversity increases the chances of species survival under adverse conditions. Example: Agricultural Crops: Different varieties of rice or wheat possess genetic variations that make them resistant to various pests and environmental conditions. 2. Species Diversity Definition: Species diversity refers to the variety and abundance of different species within a particular region or ecosystem. It includes species richness (the number of species) and species evenness (the relative abundance of each species). Importance: Ecosystem Stability: High species diversity contributes to the stability and resilience of ecosystems. Ecological Services: Different species provide various ecological services such as pollination, nutrient cycling, and decomposition. Economic Value: Biodiversity supports industries like agriculture, pharmaceuticals, and tourism. Example: Tropical Rainforests: These ecosystems are known for their high species diversity, including numerous species of plants, animals, fungi, and microorganisms. 3. Ecosystem Diversity Definition: Ecosystem diversity refers to the variety of ecosystems in a given region. It includes the different habitats, biotic communities, and ecological processes in the environment. Importance: Climate Regulation: Diverse ecosystems, such as forests, wetlands, and oceans, play crucial roles in regulating the Earth’s climate. Resource Availability: Ecosystem diversity ensures the availability of a wide range of natural resources. Biodiversity Support: Diverse ecosystems support a variety of life forms by providing different niches and habitats. Example: Coral Reefs and Deserts: The Great Barrier Reef represents a marine ecosystem with a unique community of species, while the Sahara Desert represents a terrestrial ecosystem with its own distinct flora and fauna. Interconnections and Conservation Interconnectedness: The three levels of biodiversity are interconnected. Genetic diversity within a species can affect species diversity, which in turn influences ecosystem diversity. Conservation efforts often target these levels simultaneously to ensure the protection of the entire spectrum of biodiversity. Conservation Strategies: Protected Areas: Establishing national parks, wildlife sanctuaries, and biosphere reserves to protect habitats and species. Legislation: Enforcing laws and regulations to protect endangered species and their habitats. Sustainable Practices: Promoting sustainable agricultural, forestry, and fishing practices to reduce human impact on biodiversity. Restoration Ecology: Rehabilitating degraded ecosystems to restore their biodiversity and ecological functions. Conclusion Biodiversity at genetic, species, and ecosystem levels is vital for the health and stability of the planet. It ensures the functionality and resilience of ecosystems, provides resources and ecological services, and supports human well-being. Conserving biodiversity requires understanding these levels and implementing integrated strategies to protect and sustain life on Earth. Also Read Ecological succession Detailed Analysis Bio-geochemical cycles Detailed Analysis Ecological Pyramid Detailed Analysis Energy Flow Detailed Analysis Decomposition Detailed Analysis  

Environment

Ecological succession Detailed Analysis

Ecological succession  Ecological succession is the process through which ecosystems change and develop over time, resulting in a gradual and orderly replacement of one community by another. This process involves changes in species composition, community structure, and ecosystem functions. Here’s a detailed analysis of ecological succession: 1. Types of Ecological Succession 1.1. Primary Succession: Definition: Occurs in lifeless areas where there is no soil or organic matter present initially. It begins on bare rock surfaces or newly formed land. Process: Pioneer Species: The first organisms to colonize are often lichens and mosses, which can survive harsh conditions and begin soil formation. Soil Formation: As pioneers grow, die, and decompose, they contribute to soil development, allowing for the growth of more complex plants. Intermediate Stages: Grasses, shrubs, and small herbs begin to establish as the soil improves. These species further alter the environment, enabling more diverse plant communities to establish. Climax Community: Eventually, a stable and mature community, often a forest or grassland, is established, characterized by a high degree of biodiversity and complex interactions. Example: Succession on volcanic lava flows or glacial moraines. 1.2. Secondary Succession: Definition: Occurs in areas where an existing ecosystem has been disturbed or disrupted but where soil and some organisms remain. Process: Initial Colonizers: Weedy and fast-growing plants, such as grasses and shrubs, quickly colonize disturbed areas. Intermediate Stages: As soil quality improves and competition increases, shrubs and small trees start to replace the initial colonizers. Mature Community: The ecosystem gradually returns to a mature, stable state, similar to the original community before disturbance. Example: Succession in abandoned agricultural fields or after forest fires. 2. Stages of Ecological Succession 2.1.Pioneer Stage: Description: Characterized by the initial colonization of an area by hardy, often low-growing species. Species: Lichens, mosses, and small grasses. Processes: These species begin to break down rock and organic material, contributing to soil formation and creating conditions for other species. 2.2. Early Successional Stage: Description: The environment becomes more hospitable for a wider range of species. Species: Grasses, herbs, and shrubs. Processes: Increased soil depth and fertility support more diverse plant life, which in turn attracts herbivores and other animals. 2.3.Mid-Successional Stage: Description: The community becomes more complex with the addition of larger plants and more diverse animal species. Species: Small trees, larger shrubs, and more complex herbaceous plants. Processes: The growing vegetation provides habitats for a wider range of animals and contributes to further soil development. 2.4. Climax Stage: Description: The community reaches a stable, mature state with high biodiversity and complex interactions. Species: Mature forests or grasslands, depending on the region. Processes: The ecosystem achieves a balance, with species composition remaining relatively stable until disrupted by a significant disturbance. 3. Factors Influencing Ecological Succession 3.1.Climate: Influence: Temperature, precipitation, and seasonal variations affect the types of species that can establish and thrive during succession. 3.2. Soil Conditions: Influence: Soil depth, nutrient content, and pH influence the types of plants that can grow and the rate of succession. 3.3. Disturbance: Influence: Natural disturbances (e.g., fires, floods) and human activities (e.g., deforestation, agriculture) can reset succession to an earlier stage or alter its trajectory. 3.4. Species Interactions: Influence: Competition, predation, and mutualistic relationships between species can affect the rate and direction of succession. 4. Case Studies 4.1. Mount St. Helens Eruption (1980): Primary Succession: The volcanic eruption created new land with bare rock. Pioneer species like lichens and mosses began colonizing the area, followed by grasses, shrubs, and eventually a diverse forest ecosystem. 4.2. Abandoned Agricultural Field: Secondary Succession: Once farming ceased, the field was quickly colonized by weedy species. Over time, grasses and shrubs established, followed by young trees, leading to a mature forest ecosystem. Practice Questions Question: Describe the difference between primary and secondary succession, and provide an example of each. Answer Outline: Primary Succession: Occurs on bare rock or newly formed land with no soil. Example: Succession on a volcanic lava flow. Secondary Succession: Occurs in areas where soil remains after a disturbance. Example: Succession in an abandoned agricultural field. Question: What role do pioneer species play in the process of ecological succession? How do they contribute to soil formation? Answer Outline: Pioneer species, like lichens and mosses, colonize harsh environments and start breaking down rock into soil. Their decomposition contributes organic material, forming soil and making the environment more hospitable for other species. Question: Explain the concept of climax community in ecological succession. How does it differ from earlier successional stages? Answer Outline: A climax community is a stable, mature ecosystem with high biodiversity and complex interactions. It differs from earlier stages by having more diverse and stable species composition, with a balanced ecosystem structure. Question: How do disturbances affect the process of ecological succession? Provide examples of natural and human-induced disturbances. Answer Outline: Disturbances can reset or alter succession by removing existing vegetation and changing environmental conditions. Examples include natural disturbances like forest fires and floods, and human-induced disturbances like deforestation and urban development. Understanding ecological succession provides insights into how ecosystems develop and recover over time, highlighting the dynamic nature of natural processes and the resilience of ecological systems. Also Read Bio-geochemical cycles Detailed Analysis Ecological Pyramid Detailed Analysis Energy Flow Detailed Analysis Decomposition Detailed Analysis Interaction of Biotic and Abiotic Components

Bio-geochemical cycles  
Environment

Bio-geochemical cycles Detailed Analysis

Bio-geochemical cycles   Bio-geochemical cycles describe the movement and transformation of elements and compounds through biological, geological, and chemical processes in ecosystems. These cycles ensure the recycling of essential nutrients, maintaining ecosystem health and function. Here’s a detailed analysis of the major bio-geochemical cycles: 1. Carbon Cycle 1.1.Processes: Photosynthesis: Plants and algae convert carbon dioxide (CO₂) from the atmosphere into organic compounds (e.g., glucose) using sunlight. Respiration: Organisms (plants, animals, microbes) release CO₂ back into the atmosphere as they metabolize organic matter for energy. Decomposition: Decomposers break down dead organisms and waste, releasing CO₂ into the soil and atmosphere. Combustion: Burning fossil fuels and biomass releases CO₂ into the atmosphere. Carbon Sequestration: Carbon is stored in long-term reservoirs, such as forests, soils, and oceans. 1.2.Human Impact: Deforestation: Reduces carbon sequestration by destroying forests that capture CO₂. Fossil Fuels: Increased combustion of fossil fuels releases excess CO₂, contributing to climate change. 2. Nitrogen Cycle 2.1. Processes: Nitrogen Fixation: Atmospheric nitrogen (N₂) is converted into ammonia (NH₃) or related compounds by nitrogen-fixing bacteria in soil or root nodules of legumes. Nitrification: Ammonia is oxidized to nitrites (NO₂⁻) and then to nitrates (NO₃⁻) by nitrifying bacteria. Assimilation: Plants absorb nitrates from the soil and use them to build proteins and nucleic acids. Ammonification: Decomposers convert organic nitrogen (from dead organisms) into ammonia. Denitrification: Nitrates are converted back into atmospheric nitrogen by denitrifying bacteria. 2.2.Human Impact: Fertilizers: Excessive use of nitrogen fertilizers can lead to nutrient runoff, causing eutrophication in aquatic systems. Industrial Activities: Increase in nitrogen oxides (NOx) from burning fossil fuels contributes to air pollution and acid rain. 3. Phosphorus Cycle 3.1.Processes: Weathering: Phosphorus is released from rocks into the soil and water through the weathering process. Absorption: Plants absorb phosphorus from the soil. Consumption: Herbivores obtain phosphorus by consuming plants, and carnivores obtain it by eating herbivores. Decomposition: Decomposers break down organic matter, returning phosphorus to the soil. Sedimentation: Phosphorus can be deposited into sediments in aquatic systems and become part of the geological cycle. 3.2. Human Impact: Fertilizers: Runoff from phosphorus-rich fertilizers can lead to eutrophication in water bodies. Land Use: Deforestation and soil erosion can affect phosphorus availability and its cycling in ecosystems. 4. Water Cycle 4.1. Processes: Evaporation: Water is converted from liquid to vapor from oceans, lakes, and other water bodies. Condensation: Water vapor cools and condenses into clouds. Precipitation: Water returns to the surface as rain, snow, or hail. Infiltration: Water soaks into the soil and replenishes groundwater supplies. Runoff: Water flows over the surface and returns to water bodies like rivers, lakes, and oceans. 4.2. Human Impact: Water Pollution: Contaminants from industrial processes, agriculture, and sewage can affect water quality. Climate Change: Alters precipitation patterns and impacts water availability and distribution. 5. Sulfur Cycle 5.1.Processes: Volcanic Eruptions: Release sulfur dioxide (SO₂) into the atmosphere. Oxidation: SO₂ is oxidized to sulfuric acid (H₂SO₄) and returns to the surface as acid rain. Assimilation: Plants absorb sulfate (SO₄²⁻) from the soil. Decomposition: Decomposers break down organic sulfur compounds, returning sulfur to the soil. Reduction: Sulfates are reduced to hydrogen sulfide (H₂S) by sulfate-reducing bacteria in anaerobic conditions. 5.2.Human Impact: Industrial Activities: Emissions of sulfur dioxide from burning fossil fuels contribute to acid rain and environmental damage. Mining: Releases sulfur compounds and can lead to soil and water contamination. Practice Questions Question: Describe the role of nitrogen-fixing bacteria in the nitrogen cycle. How do they contribute to soil fertility? Answer Outline: Nitrogen-fixing bacteria convert atmospheric nitrogen (N₂) into ammonia (NH₃) or related compounds that plants can absorb and use. This process enriches the soil with nitrogen, improving soil fertility and supporting plant growth. Question: Explain the impact of deforestation on the carbon cycle. How does it affect atmospheric CO₂ levels? Answer Outline: Deforestation reduces the number of trees that absorb CO₂ during photosynthesis, leading to increased atmospheric CO₂ levels. This contributes to climate change by enhancing the greenhouse effect. Question: How does the phosphorus cycle differ from the nitrogen cycle in terms of its movement and sources? Answer Outline: The phosphorus cycle does not include a gaseous phase like the nitrogen cycle. Phosphorus moves through soil, water, and organisms, primarily from rock weathering and sedimentation. Nitrogen, in contrast, involves atmospheric N₂ and has processes like fixation, nitrification, and denitrification. Question: Discuss the effects of excessive nitrogen fertilizer use on aquatic ecosystems. Answer Outline: Excessive nitrogen fertilizers can lead to nutrient runoff into aquatic systems, causing eutrophication. This results in algal blooms, decreased oxygen levels, and harm to aquatic life due to hypoxia and changes in species composition. Question: What is the significance of water infiltration in the water cycle? How does it contribute to groundwater replenishment? Answer Outline: Water infiltration allows water to soak into the soil, replenishing groundwater supplies. This process is crucial for maintaining groundwater levels, supporting plant growth, and providing water for human use and ecosystems. Understanding these cycles helps reveal how ecosystems function and maintain balance, and how human activities can impact these critical processes. Also Read Ecological Pyramid Detailed Analysis Energy Flow Detailed Analysis Decomposition Detailed Analysis Interaction of Biotic and Abiotic Components Components of Ecosystem UPSC

Environment

Ecological Pyramid Detailed Analysis

Ecological Pyramid Detailed Analysis Ecological pyramids are graphical representations that illustrate the distribution of energy, biomass, or numbers of organisms at each trophic level in an ecosystem. They provide a visual summary of the structure and functioning of ecosystems. There are three main types of ecological pyramids: 1. Pyramid of Energy Definition: Represents the amount of energy available at each trophic level in an ecosystem. Characteristics: Energy Flow: Energy is typically measured in units like kilocalories (kcal) or joules (J) and decreases as it moves up trophic levels. Shape: Always upright because energy decreases as it is transferred through the trophic levels due to the loss of energy at each level (approximately 10% is transferred to the next level, while the rest is lost as heat). Example: Pyramid of Energy for a Terrestrial Ecosystem: Producers (e.g., plants): Capture solar energy through photosynthesis. Primary Consumers (e.g., herbivores): Obtain energy by consuming plants. Secondary Consumers (e.g., carnivores): Obtain energy by consuming herbivores. Tertiary Consumers (e.g., top predators): Obtain energy by consuming other carnivores. 2. Pyramid of Biomass Definition: Represents the total biomass (total mass of living organisms) at each trophic level in an ecosystem. Characteristics: Biomass Measurement: Biomass is usually measured in grams per square meter (g/m²) or kilograms per hectare (kg/ha). Shape: Can be upright, inverted, or even irregular, depending on the ecosystem. In some aquatic ecosystems, the pyramid of biomass is inverted because primary producers (like phytoplankton) have a much smaller biomass compared to the biomass of herbivores. Example: Pyramid of Biomass in a Forest Ecosystem: Producers (e.g., trees, plants): Have the highest biomass because they form the base of the food web. Primary Consumers (e.g., insects, small herbivores): Have lower biomass compared to producers. Secondary Consumers (e.g., birds, small mammals): Have even lower biomass. Tertiary Consumers (e.g., large carnivores): Have the lowest biomass. 3. Pyramid of Numbers Definition: Represents the number of individual organisms at each trophic level in an ecosystem. Characteristics: Number Measurement: Measured in terms of individual organisms per unit area or volume. Shape: Can be upright, inverted, or irregular, depending on the ecosystem. In some ecosystems, a few large producers (like trees) can support many herbivores, leading to an inverted pyramid. Example: Pyramid of Numbers in a Grassland Ecosystem: Producers (e.g., grasses): Usually have the highest number of individuals. Primary Consumers (e.g., insects, small herbivores): Have fewer individuals compared to producers but more than higher trophic levels. Secondary Consumers (e.g., small carnivores): Have fewer individuals compared to primary consumers. Tertiary Consumers (e.g., large predators): Have the fewest individuals. Practice Questions Question: Explain why the pyramid of energy is always upright. What does this tell us about energy transfer in ecosystems? Answer Outline: The pyramid of energy is always upright because energy decreases as it moves up trophic levels due to energy loss as heat and through metabolic processes. This reflects the inefficiency of energy transfer between trophic levels and the need for a large base of producers to support higher trophic levels. Question: Describe how the shape of the pyramid of biomass can vary between terrestrial and aquatic ecosystems. Provide an example of each. Answer Outline: Terrestrial Ecosystems: Typically have an upright pyramid of biomass because producers (plants) have a large biomass relative to consumers. Aquatic Ecosystems: Often have an inverted pyramid of biomass because phytoplankton (producers) have a smaller biomass than the larger biomass of herbivores like zooplankton. Question: How can the pyramid of numbers differ from the pyramid of biomass? Provide an example of an ecosystem where the pyramid of numbers might be inverted. Answer Outline: The pyramid of numbers can be inverted if a few large producers support many herbivores. For example, in a forest ecosystem, a single tree (one large producer) can support a large number of insects (herbivores), resulting in an inverted pyramid of numbers. Question: In a grassland ecosystem, what would the pyramid of energy, biomass, and numbers likely look like? Describe the expected shapes for each pyramid and explain why. Answer Outline: Pyramid of Energy: Upright, showing a decrease in energy as you move up trophic levels from producers to consumers. Pyramid of Biomass: Upright, with the largest biomass at the producer level and decreasing at higher trophic levels. Pyramid of Numbers: Upright, with many producers (grass) supporting fewer herbivores and even fewer carnivores. Understanding ecological pyramids provides insights into how energy, biomass, and populations are distributed in ecosystems and highlights the importance of producers in supporting all other trophic levels. Also Read Energy Flow Detailed Analysis Decomposition Detailed Analysis Interaction of Biotic and Abiotic Components Components of Ecosystem UPSC Difference Between Food Chain and Food Web

Environment

Energy Flow Detailed Analysis

Energy Flow Detailed Analysis Energy flow is a fundamental concept in ecology that describes how energy is transferred through an ecosystem from one trophic level to another. Here’s a detailed analysis of energy flow, including its principles, pathways, and the factors influencing it. 1. Principles of Energy Flow 1.1. Energy Transfer Efficiency: Definition: The efficiency of energy transfer between trophic levels, usually around 10% on average. Explanation: Only a fraction of the energy from one trophic level is passed to the next. This loss occurs because energy is used for metabolic processes, growth, and reproduction, and is eventually lost as heat. 1.2. First Law of Thermodynamics: Definition: Energy cannot be created or destroyed, only transformed from one form to another. Explanation: In ecosystems, energy from the sun is transformed into chemical energy by producers and then passed through consumers and decomposers. 1.3.Second Law of Thermodynamics: Definition: In any energy transfer, some energy is lost as heat. Explanation: This loss results in a decrease in the amount of usable energy available at each successive trophic level. 2. Pathways of Energy Flow 2.1. Producers (Autotrophs): Role: Convert solar energy into chemical energy through photosynthesis. Process: Producers absorb sunlight and use it to synthesize organic compounds (e.g., glucose) from carbon dioxide and water. Example: Plants, algae, and cyanobacteria. 2.2. Primary Consumers (Herbivores): Role: Feed on producers to obtain energy. Process: Herbivores consume plant material and convert the chemical energy in plant tissues into energy for their own growth, reproduction, and metabolism. Example: Insects, rabbits, and deer. 2.3. Secondary Consumers (Carnivores): Role: Feed on primary consumers to obtain energy. Process: Carnivores convert the chemical energy stored in the tissues of herbivores into their own energy, continuing the flow of energy through the ecosystem. Example: Frogs, small predators like spiders. 2.4.Tertiary Consumers (Top Predators): Role: Feed on secondary consumers and sometimes primary consumers. Process: Top predators occupy the highest trophic level and obtain energy from consuming other consumers. Example: Eagles, lions. 2.5. Decomposers (Saprotrophs): Role: Break down dead organisms and waste products. Process: Decomposers recycle nutrients back into the ecosystem and release energy in the form of heat during the decomposition process. Example: Bacteria, fungi, earthworms. 3. Energy Flow Models 3.1. Food Chains: Definition: A linear sequence of energy flow from producers to various levels of consumers. Example: Grass → Grasshopper → Frog → Snake. Characteristics: Simplistic model showing a single path of energy transfer. 3.2.Food Webs: Definition: A complex network of interconnected food chains within an ecosystem. Example: In a forest ecosystem, different species may occupy multiple trophic levels, and many food chains overlap. Characteristics: More realistic representation of energy flow, showing multiple feeding relationships and energy pathways. 4. Factors Influencing Energy Flow 4.1. Productivity: Gross Primary Productivity (GPP): The total amount of energy captured by producers through photosynthesis. Net Primary Productivity (NPP): The amount of energy left after producers use some for their own metabolism. This is the energy available to primary consumers. 4.2. Trophic Efficiency: Definition: The efficiency with which energy is transferred from one trophic level to the next. Factors: Influenced by the type of organisms, their metabolic needs, and the amount of energy lost as heat. 4.3.Biomass Pyramids: Definition: Graphical representations showing the amount of biomass (organic material) at each trophic level. Characteristics: Typically, biomass decreases at higher trophic levels due to energy loss. Practice Questions Question: Explain the concept of trophic efficiency and how it affects the amount of energy available at higher trophic levels. Answer Outline: Trophic efficiency is the percentage of energy transferred from one trophic level to the next, usually around 10%. This means that only a fraction of energy is available to higher trophic levels, leading to decreased energy and biomass at each successive level. Question: Describe the roles of producers, primary consumers, and decomposers in an ecosystem’s energy flow. Answer Outline: Producers: Convert sunlight into chemical energy through photosynthesis. Primary Consumers: Eat producers to obtain energy and nutrients. Decomposers: Break down dead organisms and waste, recycling nutrients and releasing energy as heat. Question: Create a simple food chain and discuss the flow of energy from producers to tertiary consumers. Answer Outline: Food Chain Example: Algae → Zooplankton → Small Fish → Large Fish Energy Flow: Energy flows from algae (producers) to zooplankton (primary consumers), to small fish (secondary consumers), and finally to large fish (tertiary consumers). Energy decreases at each level due to loss as heat and metabolic processes. Question: How do food webs provide a more accurate representation of energy flow compared to food chains? Answer Outline: Food webs show multiple, interconnected food chains and various feeding relationships in an ecosystem. They provide a more comprehensive view of energy flow and interactions between species, reflecting the complexity of real-world ecosystems. Understanding energy flow helps illustrate how ecosystems function and how energy is distributed and utilized among different organisms. Also Read Decomposition Detailed Analysis Interaction of Biotic and Abiotic Components Components of Ecosystem UPSC Difference Between Food Chain and Food Web Ecosystem Explained UPSC

Environment

Decomposition Detailed Analysis

Decomposition Detailed Analysis Decomposition is a fundamental ecological process that breaks down dead organic material into simpler substances, recycling nutrients and contributing to ecosystem health. Here’s a detailed analysis of decomposition, including its stages, key organisms involved, and its ecological importance. 1. Stages of Decomposition 1.1. Fresh Stage: Description: Begins immediately after death. The body or organic material starts to cool and the metabolic processes cease. Processes: Bacteria and fungi start to colonize the dead material. Enzymes begin breaking down complex molecules into simpler compounds. 1.2. Putrefaction Stage: Description: Characterized by the release of gases like methane, hydrogen sulfide, and ammonia, which cause the material to bloat and emit odors. Processes: Anaerobic bacteria (those that do not require oxygen) become more active, breaking down proteins and producing foul-smelling compounds. 1.3. Black Putrefaction Stage: Description: The material turns dark and becomes liquefied. The process of breaking down proteins continues. Processes: Fungi and bacteria further decompose the material, and the nutrient-rich liquid starts to seep into the surrounding environment. 1.4.  Dry Decay Stage: Description: The material has mostly decomposed, leaving behind a dry, brittle residue. Processes: Decomposition is largely completed by fungi and bacteria. The remaining material is primarily mineral and a small amount of organic matter. 2. Key Organisms Involved in Decomposition 2.1. Microorganisms: Bacteria: Play a primary role in breaking down proteins, fats, and carbohydrates. They are essential for the initial breakdown of organic matter. Fungi: Decompose tougher materials like cellulose and lignin found in plant tissues. They are crucial in breaking down wood and leaf litter. 2.2. Invertebrates: Insects (e.g., beetles, flies): Help to break down material mechanically and contribute to the decomposition process by feeding on it and laying eggs. Earthworms: Aerate the soil and break down organic matter, speeding up decomposition by mixing it into the soil. 2.3.Vertebrates: Scavengers (e.g., vultures, coyotes): Feed on dead animals, contributing to the decomposition by consuming large amounts of organic material. 3. Ecological Importance of Decomposition 3.1. Nutrient Recycling: Description: Decomposition returns essential nutrients like nitrogen, phosphorus, and potassium to the soil, making them available for uptake by plants. Importance: This recycling process supports plant growth and maintains soil fertility. 3.2. Soil Formation: Description: Organic matter from decomposed material contributes to soil structure, improving its texture and water-holding capacity. Importance: Healthy soil supports plant growth and ecosystem productivity. 3.3. Carbon Cycle: Description: Decomposition releases carbon dioxide back into the atmosphere as decomposers break down organic material. Importance: This process is a key component of the global carbon cycle, affecting climate and atmospheric carbon levels. 3.4. Disease Control: Description: Decomposers help control the spread of pathogens by breaking down dead organisms that might harbor diseases. Importance: This process reduces the risk of disease outbreaks in ecosystems. Practice Questions Question: Describe the role of bacteria and fungi in the decomposition process. How do their functions differ? Answer Outline: Bacteria: Primarily break down proteins, fats, and carbohydrates. They are crucial in the initial stages of decomposition. Fungi: Decompose more complex materials like cellulose and lignin, and are particularly important in later stages of decomposition. Question: Explain how decomposition contributes to the nutrient cycle in an ecosystem. Why is this process important for plant growth? Answer Outline: Decomposition breaks down organic matter into nutrients that are returned to the soil. These nutrients are essential for plant growth, supporting ecosystem productivity and health. Question: How does the presence of invertebrates like earthworms influence the decomposition process in soil? Answer Outline: Earthworms aerate the soil and mix organic matter into it, which speeds up decomposition and enhances soil structure and nutrient availability. Question: Discuss the impact of decomposition on the carbon cycle. How does this process affect atmospheric carbon dioxide levels? Answer Outline: Decomposition releases carbon dioxide into the atmosphere as organic material is broken down. This process is a key part of the carbon cycle, influencing global carbon levels and climate. Understanding decomposition helps highlight the interconnectedness of ecological processes and the vital roles that different organisms play in maintaining ecosystem health and function. Also Read Interaction of Biotic and Abiotic Components Components of Ecosystem UPSC Difference Between Food Chain and Food Web Ecosystem Explained UPSC  Cyclone Recurving :Detailed Analysis

Environment

Interaction of Biotic and Abiotic Components

Interaction of Biotic and Abiotic Components The interaction between biotic and abiotic components is crucial for the functioning of an ecosystem. Here’s how these interactions work: 1. Influence of Abiotic Factors on Biotic Components Climate and Weather: Temperature: Affects metabolic rates of organisms and their distribution. For example, polar bears are adapted to cold temperatures, while reptiles need warmer environments to regulate their body temperature. Precipitation: Determines the availability of water. Plants and animals in arid regions have adaptations to conserve water, while those in rainforests thrive in high moisture conditions. Soil: Nutrient Availability: Plants require specific nutrients to grow. Fertile soils support a diverse range of plant species, which in turn supports a variety of herbivores and predators. pH and Texture: Affects plant growth and soil organisms. Acidic soils may limit the types of plants that can grow, impacting the entire food web. Water: Salinity: Freshwater and marine organisms are adapted to their specific water salinity levels. Salmon, for example, migrate between freshwater rivers and the salty ocean. Water Temperature: Influences the types of species that can live in a body of water. Coral reefs, for instance, require warm water temperatures. Light: Photosynthesis: Plants need light for photosynthesis, which affects their growth and distribution. Shade-tolerant plants are found in forest undergrowth, while sun-loving plants are found in open areas. Topography: Elevation and Slope: Influence climate and soil development. High elevations may have cooler temperatures and different plant communities compared to lower elevations. Sloped areas may have different soil erosion patterns and water drainage. 2. Influence of Biotic Factors on Abiotic Components Plants: Soil Formation: Plants contribute to soil formation through leaf litter and root growth, which can improve soil structure and nutrient content. Water Cycle: Plants influence local humidity and precipitation through transpiration, releasing water vapor into the atmosphere. Animals: Erosion Control: Animal activities like burrowing and grazing can affect soil structure and erosion rates. Nutrient Cycling: Animals contribute to nutrient cycling through waste products. For example, herbivores’ droppings add nutrients to the soil, which plants can use. Microorganisms: Decomposition: Microbes break down dead organic material, returning nutrients to the soil. This process influences soil fertility and structure. Nitrogen Fixation: Certain bacteria fix atmospheric nitrogen into a form usable by plants, influencing soil nutrient levels. Examples of Interactions Forest Ecosystem: Abiotic: Soil pH and moisture levels affect which plant species can thrive. Biotic: Trees provide habitat and food for various animals, which in turn affect soil composition through their activities and waste. Coral Reef Ecosystem: Abiotic: Water temperature and salinity are critical for coral survival. Biotic: Corals build reef structures that provide habitat for numerous marine species, influencing water flow and nutrient availability. Practice Questions Question: How do soil composition and pH affect plant diversity in an ecosystem? Provide an example of how changes in soil conditions can impact plant and animal species. Answer Outline: Soil composition and pH affect nutrient availability and plant growth. For example, acidic soils may limit the growth of certain plants, affecting herbivores that rely on those plants, and subsequently impacting predators. Question: Describe how temperature and precipitation influence animal behavior and distribution in a desert ecosystem. Answer Outline: In deserts, high temperatures and low precipitation lead to behavioral adaptations such as nocturnal activity to avoid heat and water-conserving mechanisms. Species like camels are adapted to withstand these extreme conditions. Question: Explain the role of plants in influencing local climate and soil conditions in a forest ecosystem. Answer Outline: Plants contribute to local climate by affecting humidity through transpiration and can influence soil conditions by adding organic matter and nutrients through leaf litter and root systems. Question: How do microorganisms contribute to nutrient cycling and soil fertility in an ecosystem? Answer Outline: Microorganisms decompose organic matter, breaking down dead plants and animals into nutrients that enrich the soil. Nitrogen-fixing bacteria convert atmospheric nitrogen into forms usable by plants, enhancing soil fertility. These interactions highlight the interconnectedness of biotic and abiotic factors in shaping ecosystems. Also Read Components of Ecosystem UPSC Difference Between Food Chain and Food Web Ecosystem Explained UPSC  Cyclone Recurving :Detailed Analysis Temperate Cyclones: Detailed Analysis

Ecosystem
Blog, Environment

Components of Ecosystem UPSC

Components of Ecosystem To understand ecosystems in detail, it’s important to look at their main components: biotic and abiotic factors, and the roles they play. Here’s a detailed analysis with practice questions to help you test your understanding: 1. Biotic Factors Definition: Biotic Factors refer to the living components of an ecosystem. These include plants, animals, fungi, bacteria, and other organisms. Components: Producers (Autotrophs): Role: Convert sunlight into chemical energy through photosynthesis. Examples: Plants, algae, and cyanobacteria. Consumers (Heterotrophs): Primary Consumers: Herbivores that eat producers. Examples: Insects, rabbits, and deer. Secondary Consumers: Carnivores that eat primary consumers. Examples: Frogs, small predators like spiders. Tertiary Consumers: Top predators that eat secondary consumers. Examples: Eagles, lions. Decomposers (Saprotrophs): Role: Break down dead organisms and waste, recycling nutrients back into the ecosystem. Examples: Bacteria, fungi, earthworms. 2. Abiotic Factors Definition: Abiotic Factors refer to the non-living components of an ecosystem that influence the living organisms within it. Components: Climate: Temperature, precipitation, humidity, and weather patterns. Example: Rainforest climates are warm and wet, while deserts are hot and dry. Soil: Composition, pH, nutrient content, and texture. Example: Loamy soil is rich in nutrients and good for plant growth. Water: Availability, salinity, and pH. Example: Freshwater lakes have low salinity, whereas oceans have high salinity. Light: Intensity and duration affect photosynthesis and plant growth. Example: Forest understories receive less light compared to open meadows. Topography: The physical features of the land, such as mountains, valleys, and plains. Example: Mountain ecosystems have cooler temperatures and different plant species compared to lowland areas. Practice Questions Question: Explain the roles of producers, consumers, and decomposers in an ecosystem. How do these roles contribute to nutrient cycling? Answer Outline: Producers: Convert sunlight into chemical energy, forming the base of the food chain. Consumers: Obtain energy by eating other organisms. Primary consumers eat producers, secondary consumers eat primary consumers, and tertiary consumers eat secondary consumers. Decomposers: Break down dead organisms and waste, returning nutrients to the soil or water, which are then reused by producers. Question: How do abiotic factors like soil composition and water availability influence the types of organisms found in an ecosystem? Answer Outline: Soil Composition: Affects plant growth; nutrient-rich soils support diverse plant life, which in turn supports various animal species. Water Availability: Determines the types of plants that can grow; for example, drought-resistant plants in deserts versus moisture-loving plants in wetlands. Question: Describe how changes in climate could impact an ecosystem. Use an example of a specific ecosystem to illustrate your answer. Answer Outline: Example: A change in temperature in a polar ecosystem could lead to melting ice, affecting polar bears and seals. Reduced ice cover impacts hunting grounds and can alter the entire food web. Question: Create a food chain for a forest ecosystem and describe the flow of energy from producers to top consumers. Answer Outline: Food Chain Example: Oak Tree → Caterpillar → Bird → Hawk Oak Tree (Producer): Converts sunlight into energy. Caterpillar (Primary Consumer): Eats the oak tree. Bird (Secondary Consumer): Eats the caterpillar. Hawk (Tertiary Consumer): Eats the bird. Energy is transferred through each level, with energy being lost as heat at each trophic level. Also Read Difference Between Food Chain and Food Web Ecosystem Explained UPSC  Cyclone Recurving :Detailed Analysis Temperate Cyclones: Detailed Analysis Tropical cyclones in Indian Ocean

Scroll to Top